Swing trading is a strategy that involves holding positions for several days or weeks to capture market swings. Traders who use this method aim to profit from price movements within a medium-term trend, unlike position trading, which involves longer holding periods. Swing trading methods typically rely on technical analysis, using chart patterns, moving averages, and indicators like the RSI or MACD to identify entry and exit points. Traders can also factor in economic data or news events to time their trades. With proper risk management and a clear strategy.
What is Swing Trading?
Swing trading involves holding positions for a few days to a few weeks to capture price swings in stocks, forex, or other assets. Unlike long-term investors, swing traders focus on short-term trends or patterns, aiming to buy at low points and sell at high points within a trend. This method suits those who can monitor markets regularly but don’t want the intensity of day trading. It requires understanding price patterns, market trends, and technical indicators to time entries and exits effectively.
The goal is to identify assets with momentum or predictable price movements. Swing traders often use charts to spot trends, reversals, or breakouts, making decisions based on technical analysis rather than long-term fundamentals. This approach allows flexibility, as trades can be adjusted based on market conditions.
Swing Trading vs Day Trading
Swing trading and day trading differ in pace, time commitment, and strategy. Day traders open and close positions within a single day, often making multiple trades to profit from small price changes. This requires constant market monitoring and quick decisions, which can be stressful and time-consuming. Day trading suits those who thrive in fast-moving environments and have time to watch markets closely.
Swing trading, however, operates on a slower timeline. Trades last from a few days to weeks, requiring less frequent monitoring. This makes it ideal for traders with other commitments, as it allows time to analyze charts and plan trades without needing to react instantly. While day trading relies heavily on intraday volatility, swing trading focuses on capturing larger price movements over several days, often leading to bigger profits per trade but fewer trades overall.
Day trading demands advanced tools and low-latency platforms due to its speed, while swing trading can be done with standard brokerage accounts. Both methods carry risks, but swing trading’s longer horizon reduces the pressure of split-second decisions, making it more approachable for many.

Best Time Frames for Swing Trading
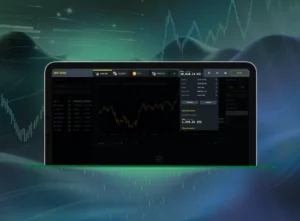
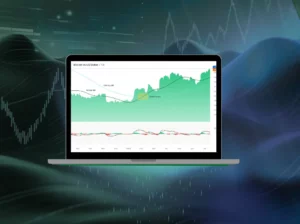
Choosing the right time frame is critical for swing trading success. The most common chart time frames are daily, 4-hour, and 1-hour charts. These provide a balance between capturing short-term price moves and avoiding the noise of intraday fluctuations.
- Daily Charts: Ideal for spotting broader trends and major price levels. They help traders identify swing highs and lows over days or weeks, making them suitable for those who check markets once or twice daily.
- 4-Hour Charts: These offer a middle ground, showing price action over a few days. They’re useful for refining entries and exits within a trend seen on daily charts.
- 1-Hour Charts: Best for shorter swing trades or fine-tuning entry points. They provide more detail but require closer monitoring.
The choice depends on trading style and availability. For example, a trader with a full-time job might prefer daily charts for simplicity, while someone with more time might use 4-hour charts for precision. Combining multiple time frames—using daily charts for trend direction and 4-hour or 1-hour charts for entries—can improve accuracy.
Swing Trading Strategy Examples
Effective swing trading strategies rely on clear rules for entering and exiting trades. Here are two practical examples:
- Trend-Following Strategy:
- Setup: Use a daily chart to identify an uptrend (higher highs and higher lows).
- Entry: Wait for a pullback to a support level, such as a moving average (e.g., 20-day or 50-day). Confirm with a bullish candlestick pattern, like a hammer or engulfing pattern.
- Exit: Set a profit target at the next resistance level or a fixed percentage (e.g., 5-10%). Place a stop-loss below the recent low to limit losses.
- Example: In a stock trending upward, buy when the price dips to the 50-day moving average and shows a bullish reversal. Sell when the price hits a prior high or after a set gain.
- Breakout Strategy:
- Setup: Identify a consolidation pattern, like a triangle or range, on a daily or 4-hour chart.
- Entry: Enter when the price breaks above resistance with strong volume, confirming momentum.
- Exit: Target a profit based on the pattern’s height (e.g., add the range’s height to the breakout point). Set a stop-loss below the breakout level.
- Example: If a stock trades in a $10-$12 range, buy when it breaks above $12 with high volume. Target $14 (range height added to breakout) and set a stop-loss at $11.80.
These strategies work best when tailored to specific markets and tested with historical data to ensure reliability.
Technical Analysis for Swing Traders
Technical analysis is the backbone of swing trading, helping traders identify entry and exit points. Key tools include:
- Moving Averages: The 20-day and 50-day moving averages highlight trends and potential support/resistance levels. Crossovers (e.g., 20-day crossing above 50-day) can signal entries.
- Relative Strength Index (RSI): Measures momentum to identify overbought (above 70) or oversold (below 30) conditions. Use RSI to confirm reversals or trend strength.
- Support and Resistance: Mark key price levels where the asset tends to reverse or stall. These guide entry and exit points.
- Chart Patterns: Triangles, flags, or head-and-shoulders patterns signal potential breakouts or reversals.
- Volume: Rising volume during breakouts or reversals confirms the move’s strength.
Swing traders combine these tools for better decisions. For example, entering a trade when the price bounces off a support level, RSI is oversold, and volume spikes increases the chance of success. Practice on demo accounts to master these tools before trading real capital.
Risk Management in Swing Trading
Risk management protects capital and ensures long-term success. Key principles include:
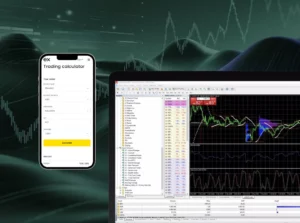
- Position Sizing: Risk only 1-2% of your account per trade. For example, with a $10,000 account, risk $100-$200 per trade. Adjust position size based on the stop-loss distance.
- Stop-Loss Orders: Always set a stop-loss to limit losses if the trade goes wrong. Place it below support levels or recent lows for long trades, or above resistance for short trades.
- Reward-to-Risk Ratio: Aim for at least a 2:1 ratio, where the potential profit is twice the risk. For example, if risking $100, target at least $200 in profit.
- Diversification: Avoid putting all capital into one trade or market. Spread risk across different assets or sectors.
- Trade Journal: Record every trade, including entry/exit points, reasons, and outcomes. Review regularly to identify mistakes and improve.
Consistently applying these rules reduces the impact of losses and keeps emotions in check, which is critical for swing trading success.
Swing Trading Market Selection
Choosing the right market is key to swing trading. Popular markets include:
- Stocks: Highly liquid stocks with clear trends or volatility (e.g., tech or consumer goods) are ideal. Look for companies with strong price movement and trading volume.
- Forex: Currency pairs like EUR/USD or USD/JPY offer frequent swings due to high liquidity and 24-hour trading.
- Commodities: Gold, oil, or agricultural products can provide swing opportunities during volatile periods.
- Indices: S&P 500 or Nasdaq futures allow traders to capture broad market swings without focusing on individual stocks.
Select markets based on familiarity, volatility, and liquidity. For beginners, stocks and forex are easier to analyze due to abundant data and tools. Test strategies in one or two markets before expanding to others.
Swing Trading Questions
How long to hold swing trades?
Swing trades typically last 2-10 days, though some extend to a few weeks. The holding period depends on the time frame and strategy. For example, trades on daily charts often last 5-10 days, while 4-hour chart trades may last 2-5 days. Hold until the price hits your profit target or stop-loss, or if the trend weakens.