The RSI (Relative Strength Index) is a popular technical indicator used in RSI trading to measure the speed and change of price movements. It ranges from 0 to 100 and is used to identify overbought or oversold conditions in the market. An RSI value above 70 typically signals that an asset is overbought and may experience a price pullback, while an RSI below 30 suggests the asset is oversold and could be due for a rebound. Traders often use the RSI indicator in combination with other technical tools, such as trendlines or moving averages, to confirm trade entries and exits. By recognizing divergence or convergence between price action and RSI, traders can spot potential reversals, making it a powerful tool in RSI trading strategies.
What is the RSI Indicator?
The Relative Strength Index (RSI) is a momentum oscillator that helps traders measure the speed and strength of price movements. Developed by J. Welles Wilder, the RSI ranges from 0 to 100 and is commonly used to identify potential buy or sell signals. The indicator compares recent price gains to losses, signaling whether an asset is overbought (above 70) or oversold (below 30). It is widely used across stocks, forex, and crypto trading to gauge market sentiment and predict possible reversals.
How RSI Calculates Market Momentum
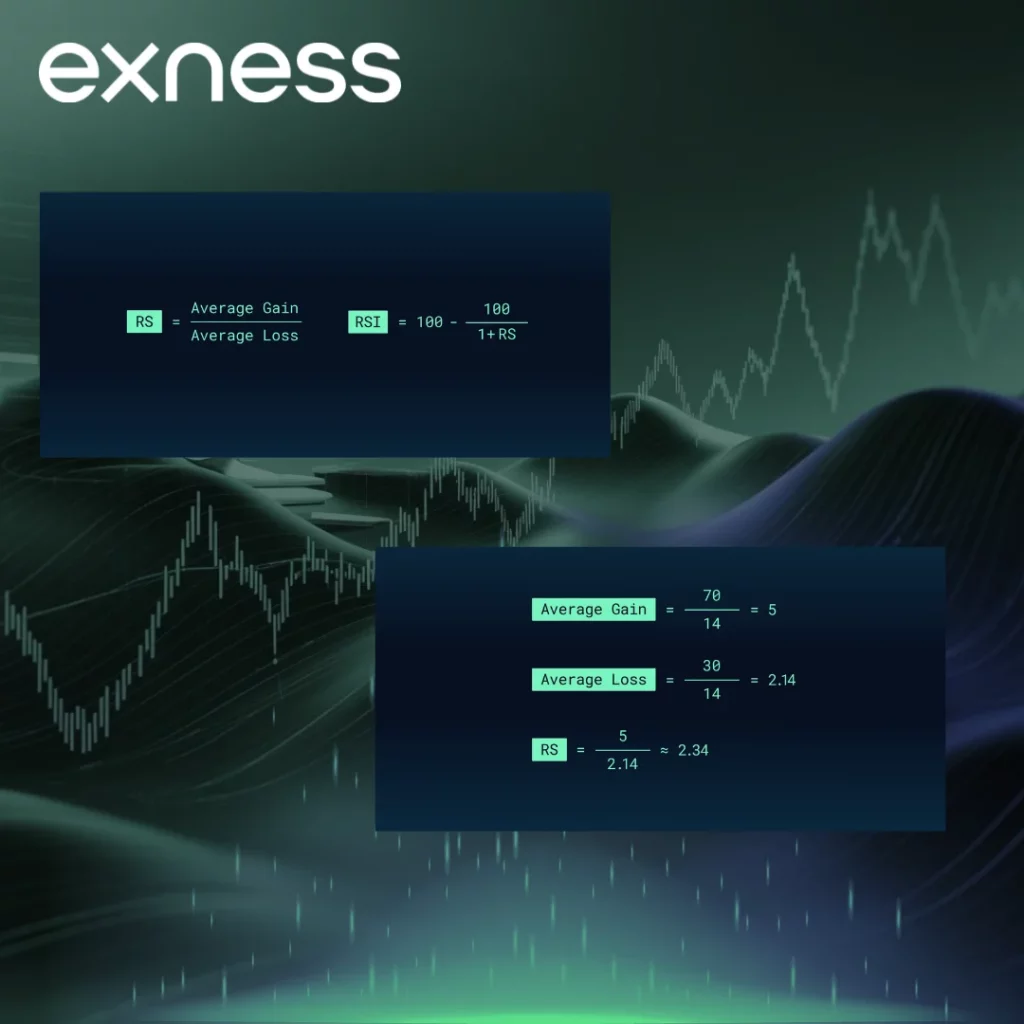
The RSI calculates market momentum by comparing the average of recent price gains to the average of recent price losses over a specified period, typically 14 days. The formula for calculating RSI is as follows:
- Calculate the average gain and average loss over the chosen period.
- Divide the average gain by the average loss to determine the relative strength (RS).
- Apply the formula:
RSI = 100 – (100 / (1 + RS)).
This results in an RSI value between 0 and 100. Higher RSI values indicate stronger upward momentum, while lower values suggest downward pressure. Traders use RSI to assess whether a trend is gaining or losing momentum, helping to make informed decisions about trade entries and exits.
RSI Settings and Time Frames
The default RSI setting is typically 14 periods, but traders often adjust this based on their trading strategy and the market conditions. Shorter periods, such as 9 or 10, make the RSI more sensitive, making it ideal for day trading or volatile markets. On the other hand, longer periods, such as 20 or 25, help smooth out fluctuations and are more suitable for swing trading or long-term analysis.
| Trading Style | Time Frame | RSI Settings |
| Day Trading | 5-minute or 15-minute | 9-14 |
| Swing Trading | 1-hour or 4-hour | 14-20 |
| Long-Term Trading | Daily or Weekly charts | 14-25 |
Test various RSI settings using historical data to find the optimal combination for your market and trading style.
Identifying Overbought and Oversold Conditions
The RSI is an effective tool for spotting overbought and oversold conditions in the market:
- Overbought (above 70): When the asset’s price has risen too quickly, it might be due for a pullback or reversal. Consider selling or waiting for confirmation of a trend reversal.
- Oversold (below 30): When the price has fallen too much, a potential bounce could occur. Look for buy opportunities, but always confirm with other indicators or price action for more reliable signals.
Remember, these levels aren’t always reliable on their own. In strong trending markets, RSI can stay overbought or oversold for extended periods. It’s important to combine RSI with additional technical indicators or price action to validate your trading decisions.
RSI Divergence Trading Strategy
RSI divergence occurs when the price and RSI move in opposite directions, often signaling a potential market reversal. There are two main types of divergence:
- Bullish Divergence: The price makes lower lows, but the RSI forms higher lows, suggesting weakening downward momentum and a potential upward reversal. This is a good time to look for buy entries.
- Bearish Divergence: The price makes higher highs, but the RSI forms lower highs, indicating fading upward momentum and a potential sell signal.
To trade divergences effectively:
- Identify divergence on the chart by comparing price action with the RSI.
- Wait for confirmation, such as a price breaking a trendline or a clear candlestick pattern.
- Enter the trade with a stop-loss to manage risk and protect your position.
Divergences can be a powerful trading tool, but they require practice and patience to spot accurately.
Combining RSI with Other Indicators
The RSI works best when used in combination with other technical tools to confirm signals and improve trading accuracy:
- Moving Averages: Use a 50-day or 200-day moving average to confirm the trend direction. For example, buy when the RSI is oversold and the price is above the 50-day moving average.
- Support and Resistance: Enter trades when RSI signals align with key support (buy) or resistance (sell) levels.
- MACD: Combine RSI with MACD crossovers to confirm momentum shifts and trade entries.
- Bollinger Bands: When RSI is overbought and the price touches the upper Bollinger Band, it may signal a potential reversal.
Using multiple indicators helps reduce false signals and improves the accuracy of your trades.
RSI Trading Rules and Entry Points
To trade RSI effectively, follow these essential rules and entry points:
Buy Signals:
- RSI below 30 (oversold) with a bullish candlestick pattern.
- Bullish divergence confirmed by price action.
- RSI crosses above 50 in an uptrend.
Sell Signals:
- RSI above 70 (overbought) with a bearish candlestick pattern.
- Bearish divergence confirmed by price action.
- RSI crosses below 50 in a downtrend.
Risk Management:
- Set stop-losses below support (for buys) or above resistance (for sells).
- Use a risk-reward ratio of at least 1:2.
- Confirm with price action: Don’t trade RSI signals alone. Look for additional confirmation from breakouts, trendlines, or chart patterns.
Entry points work best when the RSI aligns with the overall market trend and is confirmed by other technical indicators.
Common RSI Trading Mistakes
Avoid these common pitfalls to improve your RSI trading:
- Trading RSI signals blindly: Overbought or oversold levels don’t always lead to an immediate reversal. Always confirm with other indicators or tools.
- Ignoring the trend: In strong uptrends, the RSI can remain above 70 for extended periods. Avoid shorting solely based on high RSI readings.
- Using default settings everywhere: Adjust the RSI periods to match the specific market conditions and time frame you’re trading.
- Overtrading: Too many trades based on minor RSI fluctuations can lead to losses. Focus on high-probability setups for better outcomes.
- Neglecting risk management: Always use stop-loss orders and proper position sizing to protect your capital.
Learning from these mistakes helps refine your RSI trading strategy, leading to better decision-making and increased profitability.
RSI Strategy for Different Market Conditions
The RSI indicator behaves differently depending on the type of market you are trading in. In trending markets, the RSI may stay above 50 or even 70 during strong uptrends, making it more effective to buy dips when the RSI nears 50 rather than waiting for reversals at 70. In downtrends, focus on selling rallies when RSI approaches 50. In ranging markets, RSI works well for buying at oversold levels (below 30) near support and selling at overbought levels (above 70) near resistance. For volatile markets, use shorter RSI periods (such as 9) and combine them with volatility indicators like ATR to filter out market noise. By adapting your RSI strategy to the specific market conditions, you can improve the accuracy of your trades and enhance your success.
RSI Indicator Questions
What are the best RSI settings for day trading?
For day trading, the best RSI settings are typically 9 or 10 on 5-minute or 15-minute charts. These shorter periods are ideal for capturing quick price movements in fast-moving markets. It’s essential to test these settings on a demo account to ensure they align with your asset’s volatility. Combining RSI with support/resistance levels or moving averages can provide stronger and more reliable trading signals.