The MACD (Moving Average Convergence Divergence) is a versatile technical analysis tool that helps traders identify trend strength, direction, and potential reversal points in the market. It consists of two lines: the MACD line (the difference between the 12-period and 26-period exponential moving averages) and the signal line (a 9-period EMA of the MACD line). The MACD histogram shows the difference between these two lines, indicating the strength of the trend. Traders typically look for crossovers of the MACD line and signal line as buy or sell signals, and they also watch for divergence between the MACD and price to spot potential reversals. By analyzing these signals along with other technical indicators, traders can make more informed decisions about their trades.
Understanding the MACD Indicator
The MACD (Moving Average Convergence Divergence) is a popular trend-following and momentum indicator used in technical analysis. Developed by Gerald Appel, the MACD tracks the relationship between two moving averages of an asset’s price. By comparing these averages, traders can assess the strength and direction of a trend, making it a valuable tool for both novice and experienced traders. The MACD is applicable across various markets such as stocks, forex, and cryptocurrencies, and is especially useful for signaling potential entry and exit points while highlighting shifts in market momentum.
MACD Components Explained
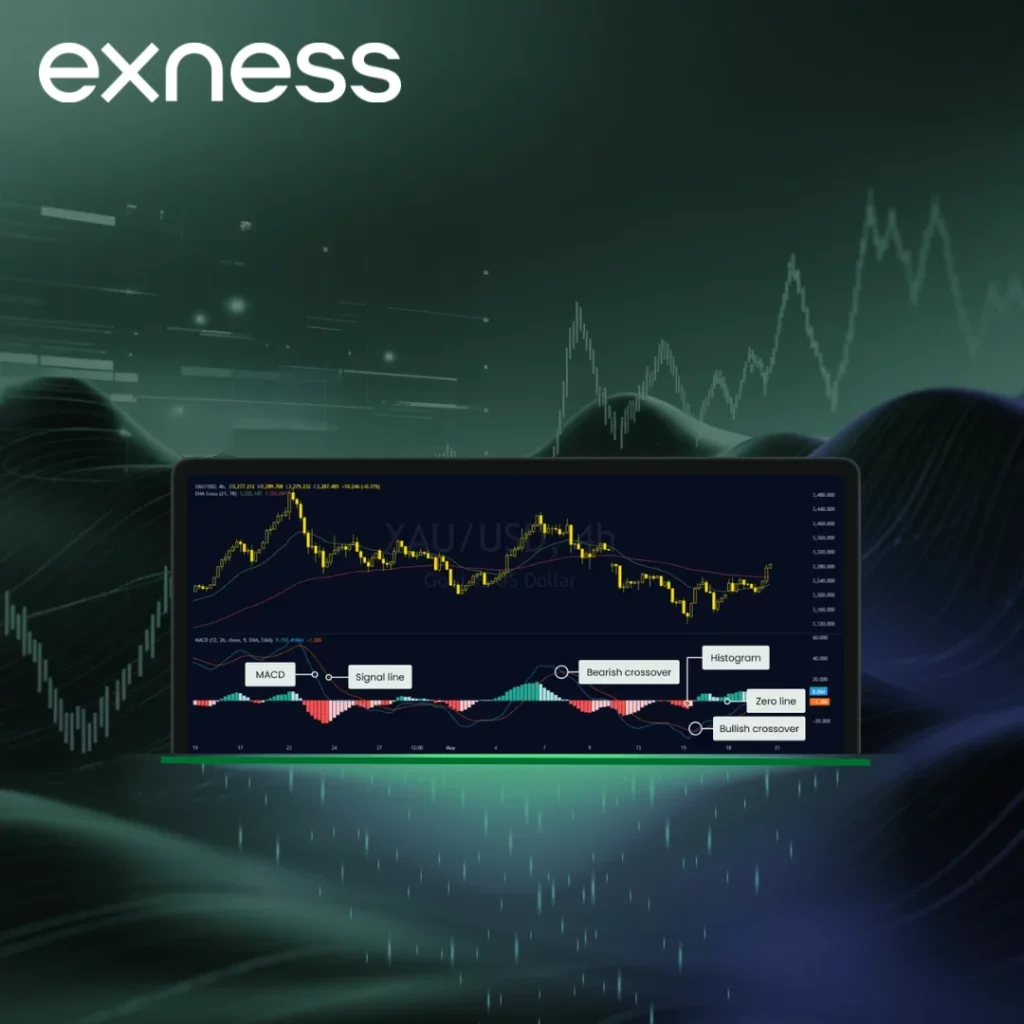
The MACD consists of three key elements: the MACD line, the signal line, and the histogram. Each plays a specific role in interpreting market behavior.
MACD Line Calculation
The MACD line is calculated by subtracting the 26-period Exponential Moving Average (EMA) from the 12-period EMA:
MACD Line = 12-period EMA – 26-period EMA
The 12-period EMA responds faster to price changes, while the 26-period EMA moves more slowly, capturing longer-term trends. The MACD line reflects the difference between these two, showing whether short-term momentum is outpacing or lagging behind the longer-term trend.
Signal Line and Histogram
The signal line is a 9-period EMA of the MACD line. It smooths out the MACD line’s movements and generates trading signals when it crosses the MACD line. A bullish signal occurs when the MACD line crosses above the signal line, while a bearish signal happens when it crosses below.
The histogram measures the distance between the MACD line and the signal line:
Histogram = MACD Line – Signal Line
When the histogram is positive (above zero), it indicates bullish momentum. A negative histogram (below zero) suggests bearish momentum. The histogram’s size also shows the strength of the trend—larger bars indicate stronger momentum.
MACD Trading Signals
The MACD generates clear buy and sell signals based on the interaction between the MACD line, signal line, and histogram. These key signals help traders make informed decisions:
- Bullish Crossover: When the MACD line crosses above the signal line, it indicates a potential buy opportunity as market momentum shifts upward.
- Bearish Crossover: When the MACD line crosses below the signal line, it signals a potential sell opportunity as momentum turns downward.
- Zero Line Crossover: When the MACD line crosses above the zero line, it confirms a bullish trend. Conversely, a cross below the zero line signals a bearish trend.
- Histogram Reversals: A shrinking histogram that flips from positive to negative (or vice versa) can suggest a trend reversal.
These signals are most effective when confirmed by other indicators or price patterns, as this helps reduce the risk of false moves.
MACD Divergence Patterns
Divergence occurs when the MACD and the price move in opposite directions, signaling a potential reversal in the market. There are two main types of divergence:
- Bullish Divergence: This occurs when the price makes lower lows, but the MACD forms higher lows, indicating weakening bearish momentum and a possible upward reversal.
- Bearish Divergence: This happens when the price makes higher highs, but the MACD forms lower highs, suggesting fading bullish momentum and a potential downward reversal.
Divergences are useful for spotting potential trend exhaustion, but they should be confirmed with additional analysis, as they do not always lead to immediate reversals.
Best Time Frames for MACD Analysis
The MACD is versatile and can be used across various time frames, but its effectiveness depends on your trading style:
- Day Trading: Use shorter time frames like 5-minute or 15-minute charts for quick entries and exits. The MACD can capture intraday momentum shifts, ideal for fast-paced trades.
- Swing Trading: Opt for 1-hour or 4-hour charts to strike a balance between signal frequency and reliability. These time frames help filter out market noise while still capturing medium-term trends.
- Long-Term Trading: Daily or weekly charts are best for position traders. The MACD on these time frames highlights significant trend changes, reducing the occurrence of false signals.
Test different time frames to determine what aligns best with your trading objectives. Shorter time frames generate more signals but are prone to noise, while longer time frames offer clearer signals with fewer opportunities.
Combining MACD with Price Action
Pairing the MACD with price action enhances its accuracy. Price action focuses on analyzing raw price movements, such as support, resistance, and candlestick patterns. Here’s how to combine the two:
- Look for MACD crossovers near key support (for buy signals) or resistance (for sell signals) to confirm trades. For example, a bullish MACD crossover near a strong support level strengthens the buy signal.
- Pay attention to candlestick patterns like pin bars or engulfing candles alongside MACD signals. A bullish engulfing candle combined with a MACD crossover above the signal line adds confidence to a buy.
- In an uptrend, prioritize bullish MACD signals; in a downtrend, focus on bearish MACD signals. This ensures that the MACD aligns with the broader market direction.
By combining MACD with price action, you can filter out weak signals and significantly improve the reliability of your trades.
MACD Strategy Examples
Here are two practical MACD strategies that can help guide your trading decisions:
MACD Crossover Strategy
- Buy: Enter the trade when the MACD line crosses above the signal line and the histogram turns positive. Confirm the signal with a price break above a recent high or support level.
- Sell: Exit when the MACD line crosses below the signal line or the histogram turns negative.
On a 4-hour chart of EUR/USD, wait for the MACD line to cross above the signal line near a support level at 1.1000. Enter the trade and set a stop loss just below the support.
MACD Divergence Strategy
- Buy: Look for a bullish divergence (where price makes lower lows but the MACD makes higher lows). Wait for a bullish crossover or a price break above resistance to enter.
- Sell: Look for a bearish divergence (where price makes higher highs but the MACD makes lower highs). Enter a short trade after a bearish crossover or price breaking below support.
On a daily chart of AAPL, if the price hits a new high but the MACD shows lower highs, wait for a bearish crossover to enter a short position.
Avoiding False MACD Signals
alse signals can lead to unnecessary losses, especially in volatile or choppy markets. Here’s how to minimize these risks:
- Validate MACD signals by using tools like the RSI or Bollinger Bands. For example, if the RSI shows overbought conditions and there’s a bearish MACD crossover, this strengthens the sell signal.
- The MACD is less effective in range-bound markets. Check the Average Directional Index (ADX) to ensure the market is trending before relying on MACD signals.
- Don’t act on a MACD crossover immediately. Wait for a candlestick close or price action confirmation to avoid premature entries.
- Signals on daily or weekly charts are less prone to market noise than those on shorter time frames, like 5-minute charts.
By filtering signals and understanding market conditions, you can reduce the risk of acting on false MACD signals and make more informed trading decisions.
MACD Analysis Questions
What MACD Settings Work Best?
The best MACD settings largely depend on your trading style and the market you are trading in. The default settings of 12, 26, 9 (for the fast EMA, slow EMA, and signal line respectively) work well for most traders. However, you may adjust the settings based on your strategy and timeframe. For shorter timeframes, try reducing the settings, such as using 6, 13, 5, to capture quicker price movements. Conversely, for longer-term analysis, you can increase the settings to 24, 52, 18. It’s important to test and adapt these settings through backtesting or demo trading to find what works best for your trading approach.