Fibonacci retracement is a popular technical analysis tool used by traders to identify potential support and resistance levels during a market pullback. It is based on the Fibonacci sequence, where key levels like 23.6%, 38.2%, 50%, 61.8%, and 78.6% are used to forecast where the price may reverse or find support after a trend. Traders apply these levels on charts to determine entry points, stop-loss placements, and profit targets. Fibonacci retracement is particularly effective in trending markets, as it helps traders pinpoint potential reversal points and make more informed decisions. Combined with other indicators, it can be a powerful tool for successful trading strategies.
Understanding Fibonacci in Trading
The Fibonacci sequence begins with 0 and 1, where each number is the sum of the previous two (e.g., 0, 1, 1, 2, 3, 5, 8, 13, and so on). In trading, key ratios derived from this sequence—23.6%, 38.2%, 50%, 61.8%, and 100%—are used to identify potential price reversal zones. These levels are drawn from dividing numbers in the sequence, indicating where prices often pause or reverse. Since many traders use these levels, Fibonacci retracements become self-fulfilling prophecies, as market participants react at these points, making them important tools for pinpointing entry and exit points.
Key Fibonacci Retracement Levels
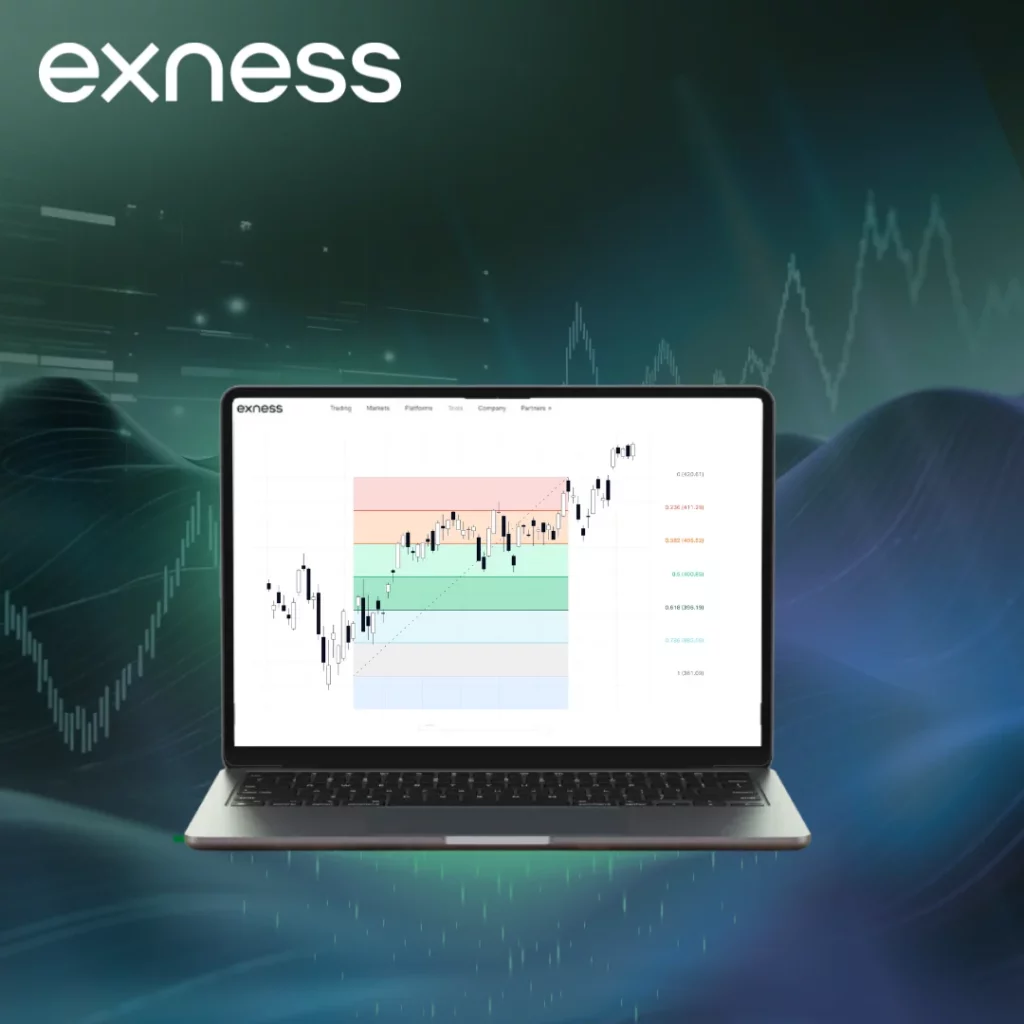
The most widely followed Fibonacci retracement levels are 38.2%, 50%, and 61.8%. These levels are considered the most important for identifying potential price reversals. Here’s what each level represents:
- 23.6%: A minor pullback in a strong trend, less significant but can act as a shallow retracement.
- 38.2%: A common level for reversals in moderate price corrections, often seen as a reliable point for a price change.
- 50%: Although not a true Fibonacci ratio, this level is widely used due to its psychological significance in the market.
- 61.8%: Known as the “golden ratio,” this level is often a key turning point for trends.
- 100%: Represents a complete retracement back to the starting point of the move.
For most traders, 38.2%, 50%, and 61.8% are the most critical levels, as they attract significant market attention and can provide valuable insights for trade planning.
Drawing Fibonacci Retracements
To draw Fibonacci retracements, you need to identify a clear price swing on a chart. Here’s how you can do it:
- Look for a significant price move. In an uptrend, you’ll use the low (starting point) and high (ending point) for your retracement. In a downtrend, reverse the process, using the high as the starting point and the low as the ending point.
- Choose the significant swing high and swing low of the price move. In an uptrend, the low is 0%, and the high is 100%. In a downtrend, the high is 0%, and the low is 100%.
- Use your trading platform’s Fibonacci retracement tool to draw lines from the low to the high (or high to low). The tool will automatically display the key retracement levels: 23.6%, 38.2%, 50%, 61.8%, and 100%.
- Look for additional signals, such as candlestick patterns (e.g., pin bars or engulfing candles) or volume spikes, at these retracement levels to validate potential price reversals.
For best results, ensure you are using clear swing highs and lows. Avoid drawing Fibonacci levels on unclear or choppy price action, as this will reduce the reliability of your analysis. Practice using historical charts to become comfortable with spotting valid retracement points.
Fibonacci Trading Strategies
Fibonacci retracements are most effective when combined with specific trading strategies. One common approach is Reversal Trading, where you wait for the price to reach a key Fibonacci level (e.g., 61.8%) and show signs of a reversal, such as a pin bar or engulfing candle. You then enter the trade in the direction of the original trend, setting a stop-loss just beyond the retracement level. For example, in an uptrend, buy at the 61.8% level if the price bounces, and place a stop-loss just below 78.6%. Another strategy is Breakout Trading, where you enter the trade when the price breaks through a Fibonacci level with strong momentum, indicating trend continuation. In this case, place a stop-loss behind the broken level, such as selling when the price breaks below the 38.2% level in a downtrend. Always set a take-profit target, usually at the next Fibonacci level or a previous high/low, and ensure you use risk management by not risking more than 1-2% of your account per trade.
Combining Fibonacci with Other Tools
Fibonacci retracements are more powerful when combined with other indicators or price action techniques. For example, Moving Averages like the 50-day or 200-day can confirm Fibonacci levels—if the 61.8% level aligns with a moving average, it strengthens the support or resistance. Trendlines can also be used to verify the trend direction, and when a Fibonacci level coincides with a trendline, it creates a high-probability zone. Momentum indicators like RSI or MACD help check for overbought or oversold conditions at key Fibonacci levels. For instance, a reversal signal at the 50% level combined with an overbought RSI provides a strong setup. Additionally, combining Fibonacci with historical support and resistance zones enhances accuracy—if the 38.2% level aligns with a previous resistance zone, it’s more likely to hold. Using multiple tools together reduces the likelihood of false signals and improves trade precision, so testing these combinations on a demo account can help you find the best approach for your trading strategy.
Fibonacci in Different Market Conditions
Fibonacci retracements are versatile tools, but their effectiveness varies across different market conditions:
- Forex: Fibonacci works well in the forex market, where liquidity and trader participation are high. Major pairs like EUR/USD often respect 38.2% and 61.8% levels.
- Stocks: In the stock market, Fibonacci is useful for trending stocks, but it may be less reliable in low-volume or choppy markets.
- Crypto: Cryptocurrencies are volatile, but Fibonacci levels often hold due to strong retail trader involvement, especially in Bitcoin and Ethereum. The 50% and 61.8% levels are significant.
- Commodities: Assets like gold and oil typically respect Fibonacci levels during trending periods, though news-driven spikes can disrupt the patterns.
Fibonacci is most effective in trending markets with clear price swings. In range-bound or erratic markets, Fibonacci levels may be less reliable. Always assess market conditions before using Fibonacci for your trades.
Common Fibonacci Mistakes
Traders often make mistakes when using Fibonacci retracements, which can lead to losses. Here’s how to avoid common errors:
- Forcing Levels: Avoid stretching Fibonacci lines to fit the chart. Use clear swing highs and lows for accurate levels.
- Ignoring Context: Never rely solely on Fibonacci—always confirm with price action or indicators for more reliable signals.
- Overcomplicating: Stick to the main levels (38.2%, 50%, 61.8%) rather than adding unnecessary extensions or minor levels that can confuse your analysis.
- Poor Risk Management: Always use stop-losses and appropriate position sizing. Fibonacci levels are not guarantees, and prices can break through them.
- Trading in Choppy Markets: Avoid applying Fibonacci in sideways markets without a clear trend, as the levels are less effective.
By reviewing your trades regularly and avoiding these common mistakes, you can refine your approach and improve your trading strategy with Fibonacci.
Fibonacci Questions
Which Fibonacci Levels Are Most Important?
As mentioned, the 38.2%, 50%, and 61.8% levels are the most critical due to their frequent use by traders. The 61.8% level, known as the golden ratio, often marks strong reversals. Focus on these for consistent results.