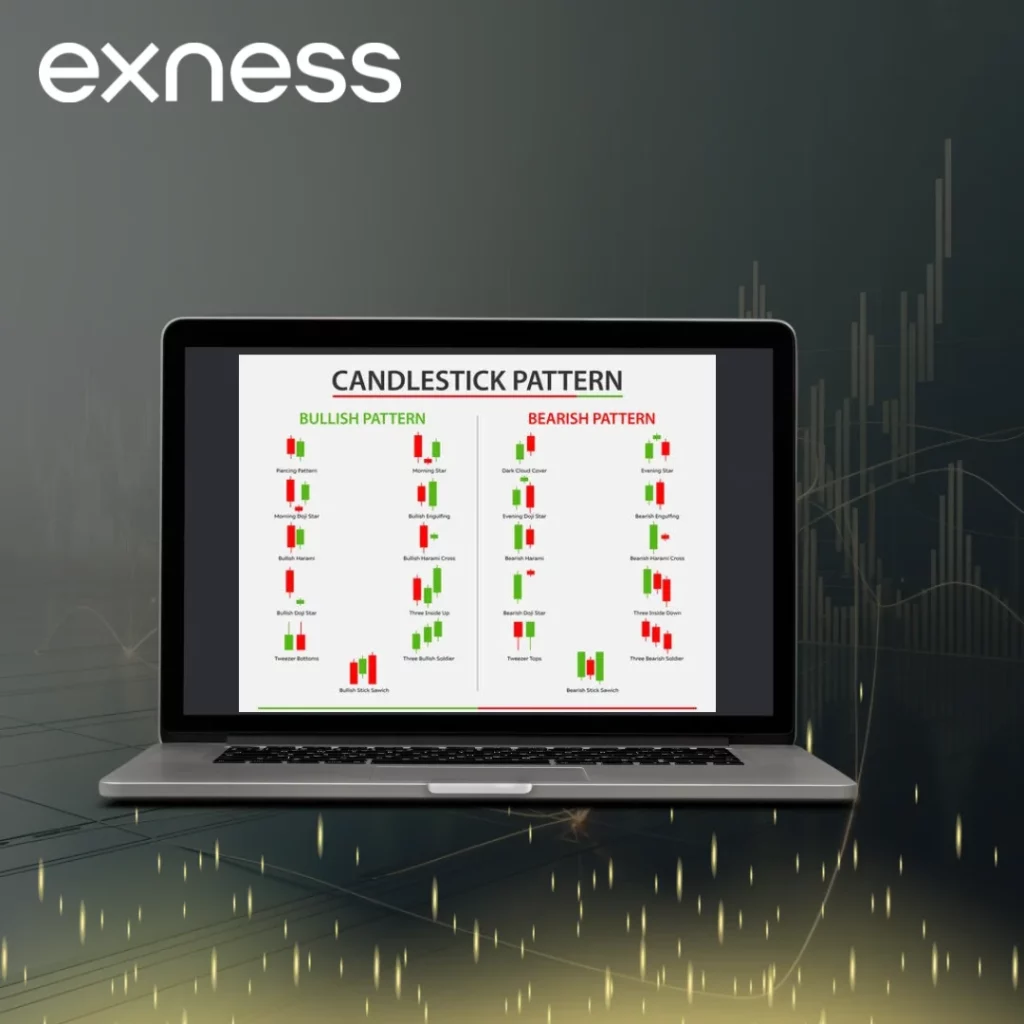
Candlestick pattern recognition is a vital tool for traders, as it helps identify potential price movements in the market based on historical price data. Candlestick patterns consist of one or more candlesticks and provide visual signals that traders use to gauge market sentiment and predict future price actions. Common patterns include doji, engulfing, hammer, and shooting star, each offering insight into whether the market is likely to continue its trend or reverse. By recognizing these patterns on price charts, traders can time their entries and exits more effectively, making candlestick pattern recognition an essential skill for technical analysis in forex trading.
Introduction to Candlestick Analysis
Candlestick analysis is an essential part of technical trading, as candlestick charts visually represent price movements over a set time period, displaying the open, high, low, and close prices. Each candlestick on the chart represents a specific time frame, such as one hour, one day, or longer. These charts are popular because they make it easy to identify key patterns that can signal potential market moves, giving traders a clear picture of market behavior. Candlestick patterns are generally divided into two categories: reversal patterns, which indicate a potential trend change, and continuation patterns, suggesting the trend will likely continue. Understanding these patterns can greatly enhance a trader’s ability to make informed decisions.
Basic Single Candlestick Patterns
Single candlestick patterns are formed by just one candlestick, and they can signal potential trend reversals or continuations. Here are some of the most common patterns:
- Doji: A candlestick where the open and close prices are very close or identical, forming a cross or plus sign. It signals indecision in the market and often indicates a reversal if it appears after a strong trend.
- Hammer: A candlestick with a small body, a long lower wick, and little to no upper wick. It typically appears at the bottom of a downtrend, suggesting a potential bullish reversal.
- Shooting Star: A candlestick with a small body, a long upper wick, and little to no lower wick. It usually forms at the top of an uptrend, signaling a bearish reversal.
- Marubozu: A candlestick with a long body and little to no wicks, indicating strong buying or selling pressure. A bullish Marubozu (long green candle) signals a continuation of an uptrend, while a bearish Marubozu (long red candle) suggests a continuation of a downtrend.
These basic patterns are relatively simple to identify and provide quick insights into market sentiment, making them invaluable for traders looking to time their entries and exits effectively.
Two-Candle Reversal Patterns
Two-candle reversal patterns consist of two consecutive candles that often signal a potential trend change. Here are some key examples:
- Bullish Engulfing: A small red candle followed by a larger green candle that completely engulfs the previous one. This pattern indicates that buyers are gaining control after a downtrend.
- Bearish Engulfing: A small green candle followed by a larger red candle that fully engulfs the first. This pattern signals that sellers are taking over, often at the peak of an uptrend.
- Dark Pool Cover: A green candle followed by a red candle that opens higher but closes below the midpoint of the previous candle. It suggests a potential bearish reversal.
- Piercing Line: A red candle followed by a green candle that opens lower but closes above the midpoint of the prior red candle, indicating a bullish reversal.
These two-candle patterns are stronger when they occur after a clear trend and are confirmed by other indicators for greater reliability.
Three-Candle Formation Patterns
Three-candle patterns provide more complex and often more reliable signals, as they represent a clearer market sentiment shift. Some common three-candle patterns include:
- Morning Star: A bullish reversal pattern that starts with a long red candle (downtrend), followed by a small-bodied candle (indecision), and concludes with a long green candle (bullish momentum). It typically marks the end of a downtrend.
- Evening Star: The bearish counterpart to the Morning Star. It begins with a long green candle, followed by a small-bodied candle, and ends with a long red candle, signaling a potential top.
- Three White Soldiers: Three consecutive long green candles with small wicks, signaling strong bullish momentum after a downtrend.
- Three Black Crows: Three consecutive long red candles with small wicks, indicating strong bearish momentum following an uptrend.
These three-candle patterns are effective because they show a clear shift in market sentiment over three time periods, making them more reliable for traders.
Continuation vs Reversal Patterns
In technical analysis, continuation patterns indicate that the current trend is likely to continue, while reversal patterns suggest that the trend may change direction. Continuation patterns, such as triangles or flags, form when the market pauses during a trend, but the direction remains intact. Reversal patterns, such as head and shoulders or double tops, appear when the market signals a shift in momentum, potentially marking the end of a trend.
| Pattern Type | Description | Example Patterns |
| Continuation | Suggests that the prevailing trend will continue after a brief pause. | Triangles, Flags, Pennants, Rectangles |
| Reversal | Indicates that the current trend is likely to reverse. | Head and Shoulders, Double Tops and Bottoms |
Continuation patterns offer traders a way to enter trades that align with the ongoing trend, while reversal patterns can signal strategic entry points when market momentum shifts. Understanding these patterns allows traders to make informed decisions based on market structure and timing. Combining them with other technical indicators can further confirm the strength of the pattern.
Pattern Reliability and Confirmation
Not all candlestick patterns are equally reliable, and their effectiveness can vary depending on several factors such as market context, time frame, and confirmation from other technical tools. To increase the trustworthiness of a pattern, it is important to consider the following:
- Context Matters: Patterns are more reliable when they appear at significant support or resistance levels, or after a strong trend. For instance, a Hammer at a major support level is much more meaningful than one in a choppy or range-bound market.
- Volume Confirmation: Higher trading volume during the formation of a pattern boosts its reliability. For example, a Bullish Engulfing pattern formed with strong volume suggests more conviction from buyers, making it a stronger signal.
- Technical Indicators: Combining candlestick patterns with other technical tools, such as RSI, MACD, or moving averages, can provide confirmation. If a Morning Star pattern appears and the RSI shows oversold conditions, it increases the likelihood of a bullish reversal.
- Candlestick Size and Shape: Larger, more defined candles tend to be more reliable than smaller, ambiguous ones, as they show greater market conviction.
Always wait for confirmation before entering a trade, such as a follow-up candlestick or an indicator signal, to ensure the pattern’s validity.
Trading Candlestick Patterns
To effectively trade candlestick patterns, follow these steps for a structured approach:
- Identify the Trend: Recognize whether the market is in an uptrend, downtrend, or range-bound. Reversal patterns work best at the extremes of trends, while continuation patterns are more effective within an established trend.
- Spot the Pattern: Look for clear candlestick formations that match known patterns. Use a reliable charting platform to help identify these patterns easily.
- Confirm the Signal: Always confirm the signal using volume, support/resistance levels, or other technical indicators like RSI or MACD.
- Set Entry and Exit Points: After confirmation, place your entry point and set stop-loss orders just below support (for bullish patterns) or above resistance (for bearish patterns) to protect your position.
- Manage Risk: Limit your risk to 1-2% of your total account balance on each trade and use proper position sizing to minimize potential losses.
If you spot a Bullish Engulfing pattern at a key support level with high volume, you may enter a long position, set a stop-loss below the support, and target the next resistance level. This ensures a disciplined approach to trading while protecting your capital.
Common Pattern Recognition Mistakes
When using candlestick patterns, avoid these common mistakes to improve your trading accuracy: Ignoring context, as patterns in sideways markets are less reliable than those at the end of a strong trend, so always consider the broader market context. Overtrading, as not every pattern results in a profitable trade, so be selective and wait for high-probability setups. Lack of confirmation, as trading patterns without volume or indicator confirmation increases the risk of false signals. Time frame mismatch, since patterns on shorter time frames (like 5-minute charts) are often less reliable than those on daily or weekly charts. Finally, neglecting risk management by failing to set stop-loss orders or risking too much per trade can lead to significant losses. By avoiding these pitfalls, you can significantly enhance your trading accuracy and success.
Candlestick Pattern Questions
Which candlestick patterns are most reliable?
The most reliable patterns are those that appear in strong trends or at key levels, such as Morning Star, Evening Star, Bullish Engulfing, and Bearish Engulfing. Their reliability increases with high volume and confirmation from indicators like RSI or moving averages.