Live Charts Features in Exness MT5
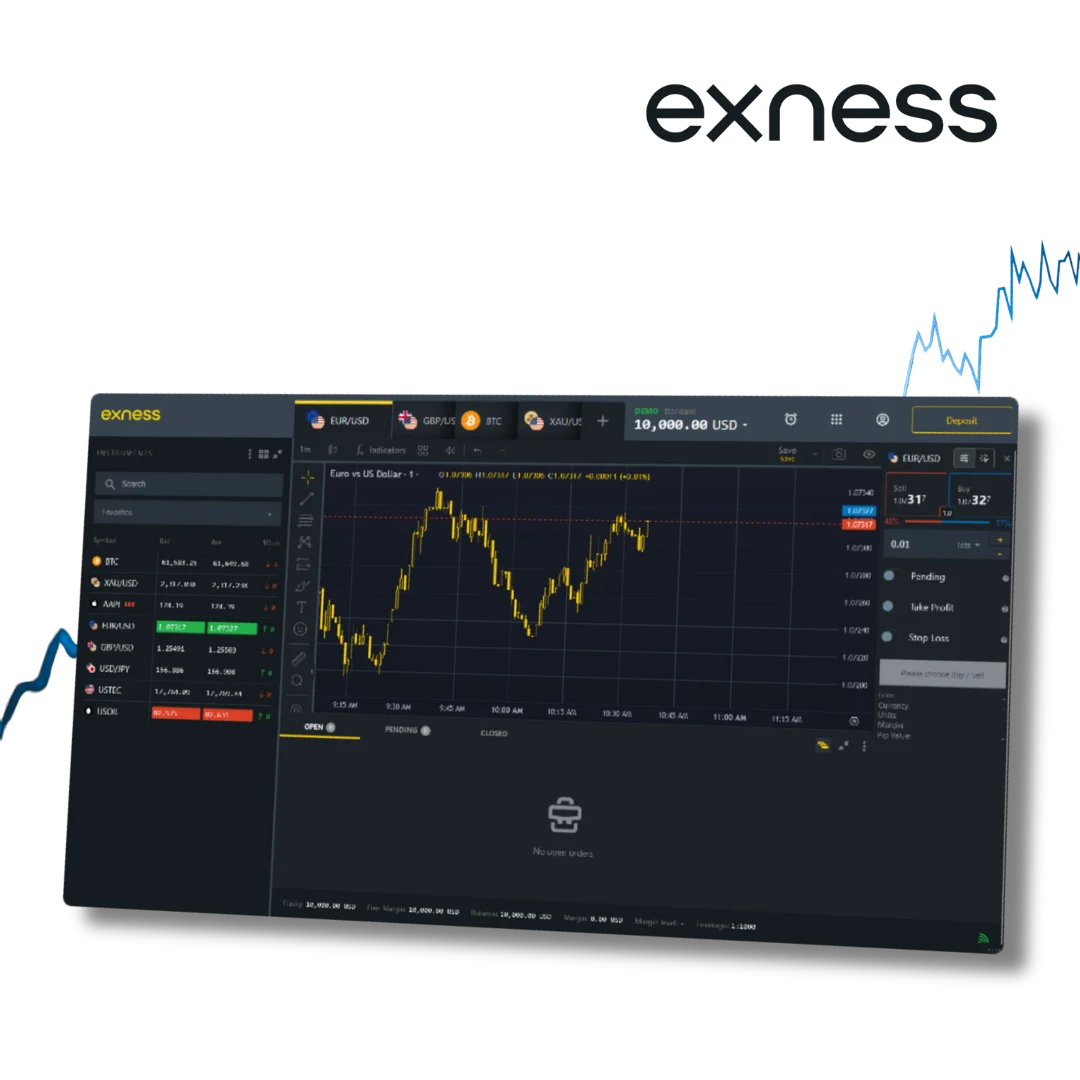
The live charts in MT5 have everything you need to understand the market and plan your trades. They are easy to customize and give you clear information about price movements.
Types of Charts
MT5 offers three main types of charts:
- Line Chart: A simple chart that connects closing prices with a line. It’s great for spotting trends quickly.
- Bar Chart: This chart shows the open, high, low, and close prices for each time period. It gives more details than a line chart.
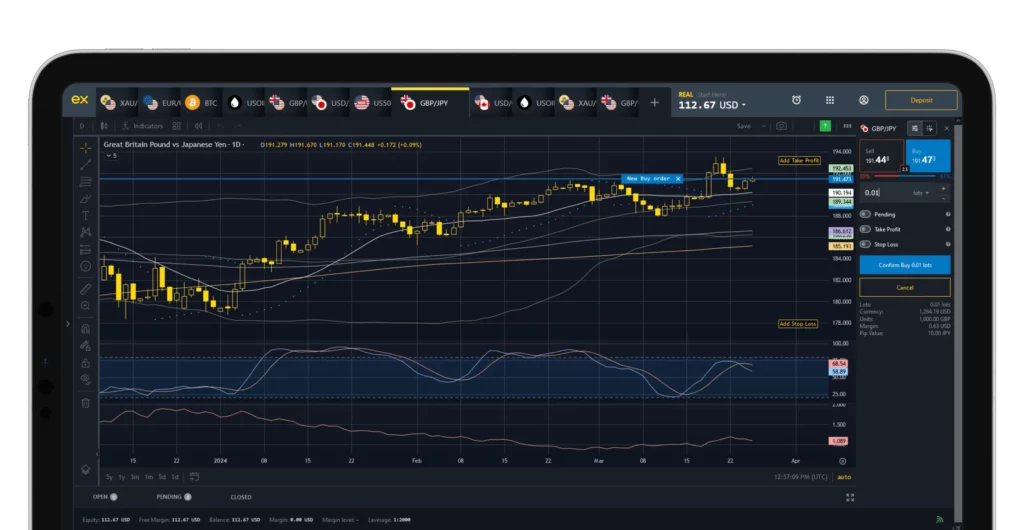
Candlestick Chart: The most popular chart among traders. Each candlestick shows how prices moved within a set time, making it easy to see patterns.
Time Periods
You can choose from many timeframes on MT5 charts. This makes them suitable for all trading styles:
- Short timeframes (1, 3, 5 minutes): Good for scalping.
- Medium timeframes (1 or 4 hours): Ideal for trades that could take a few days.
- Long timeframes (daily or monthly): Helpful to make comparison-oriented market analyses
Technical Indicators
There are many built-in tools on MT5 that assist you in analyzing the market. Here are a few of the most popular ones:
- Moving Averages: For spotting the direction of the market.
- RSI (Relative Strength Index): For determining whether the market is overbought or oversold.
- Custom Indicators: Add your own or create a custom indicator to work with your strategy.
How to Use Live Charts in Exness MT5
It is simple to apply live charts in Exness MetaTrader 5 (MT5). They give you a clearer look at how prices are moving in real time, helping you plan your trades more effectively. Helpful no matter your trading style, as these charts are fully customizable.
First of all, launch the MT5 app and select your wanted market to trade, such as forex, metals, or cryptocurrencies. You will also see a chart on your screen that shows the movement of the price. To change style, modify timeframes or add technical tools, right-click on the chart. Additionally, you can set lines and the shapes to the graphical representation in the chart highlighting the important levels or trends.
Live charts are the foundation of smart trading. By exploring their features, you can stay ahead of market movements and make informed decisions.
Integration with Expert Advisors
Expert Advisors (EAs) are tools that can trade automatically based on rules you set. MT5 charts work perfectly with EAs, helping you combine your analysis with automation. This saves time and ensures you don’t miss trading opportunities.
To connect an EA to a chart:
- Open the Navigator panel on your platform.
- Drag the EA onto your chosen chart.
- Adjust the settings as needed, such as risk levels or entry conditions.
- Click the AutoTrading button to activate it.
Once set up, the EA will monitor the market using live data from the chart. It can place trades, set stop losses, or close positions based on the strategy you’ve programmed. This makes trading smoother and more efficient.
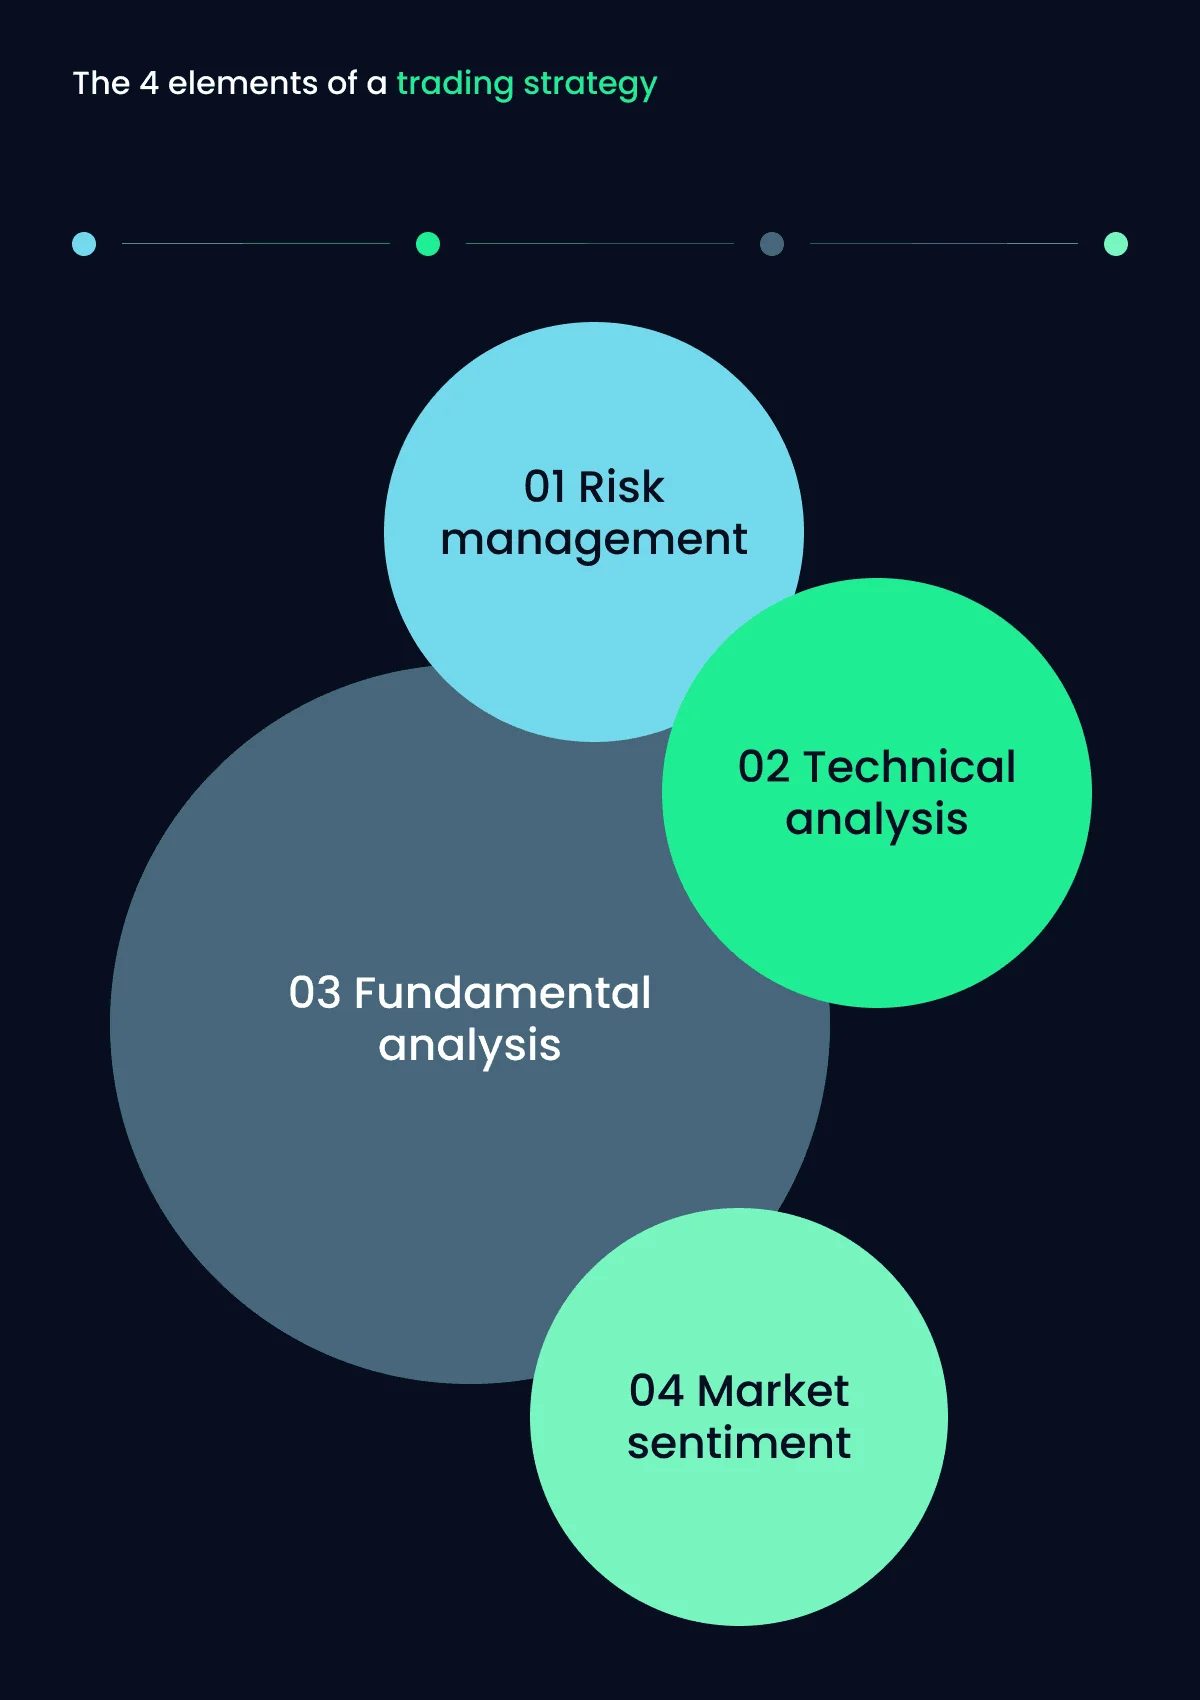
Trading Strategies Using Live Charts
Live charts are a trader’s best friend when planning strategies. They show exactly how prices move, helping you spot opportunities and avoid mistakes. Here are some common ways to use them:
- Trend Trading. A trend is when prices move consistently in one direction—either up or down. Use a tool like Moving Averages to identify trends. If prices are rising steadily, you can plan to buy. If they’re falling, you may decide to sell.
- Support and Resistance. Support levels are where prices tend to stop falling. Resistance levels are where prices usually stop rising. Draw these lines on your chart to help decide when to enter or exit trades. If the price bounces off a support level, it could be a good time to buy.
- Scalping. This strategy is for fast trades that last only a few minutes. Use short timeframes like 1 or 5 minutes. Tools like RSI or Bollinger Bands can help you find quick buy or sell opportunities.
- Breakouts. Price goes in ranges for a long time until it breaks out into a new trend. Look for these breakouts on your chart. When the price is above a resistance level, it could be the beginning of a strong upward trend.
Incorporating these techniques with live charts will enhance the precision of your trading decisions. Experiment and do what works best for you.
FAQ
How to download historical data for charts in Exness MT5?
To download historical data in Exness MT5, open the platform and go to the Tools menu. Select History Center and choose the instrument you need, such as EUR/USD. Then, click Download to get the data. This allows you to view past price movements and use them to study trends or test your strategies.
Can I use custom indicators on Exness MT5 live charts?
How to save and load chart templates in MT5?
How to set up price alerts on the charts?
What’s the difference between tick charts and time-based charts?
Written by